Sales Data Analysis by Quarter Excel Template
ABOUT THE SALES DATA ANALYSIS BY QUARTER
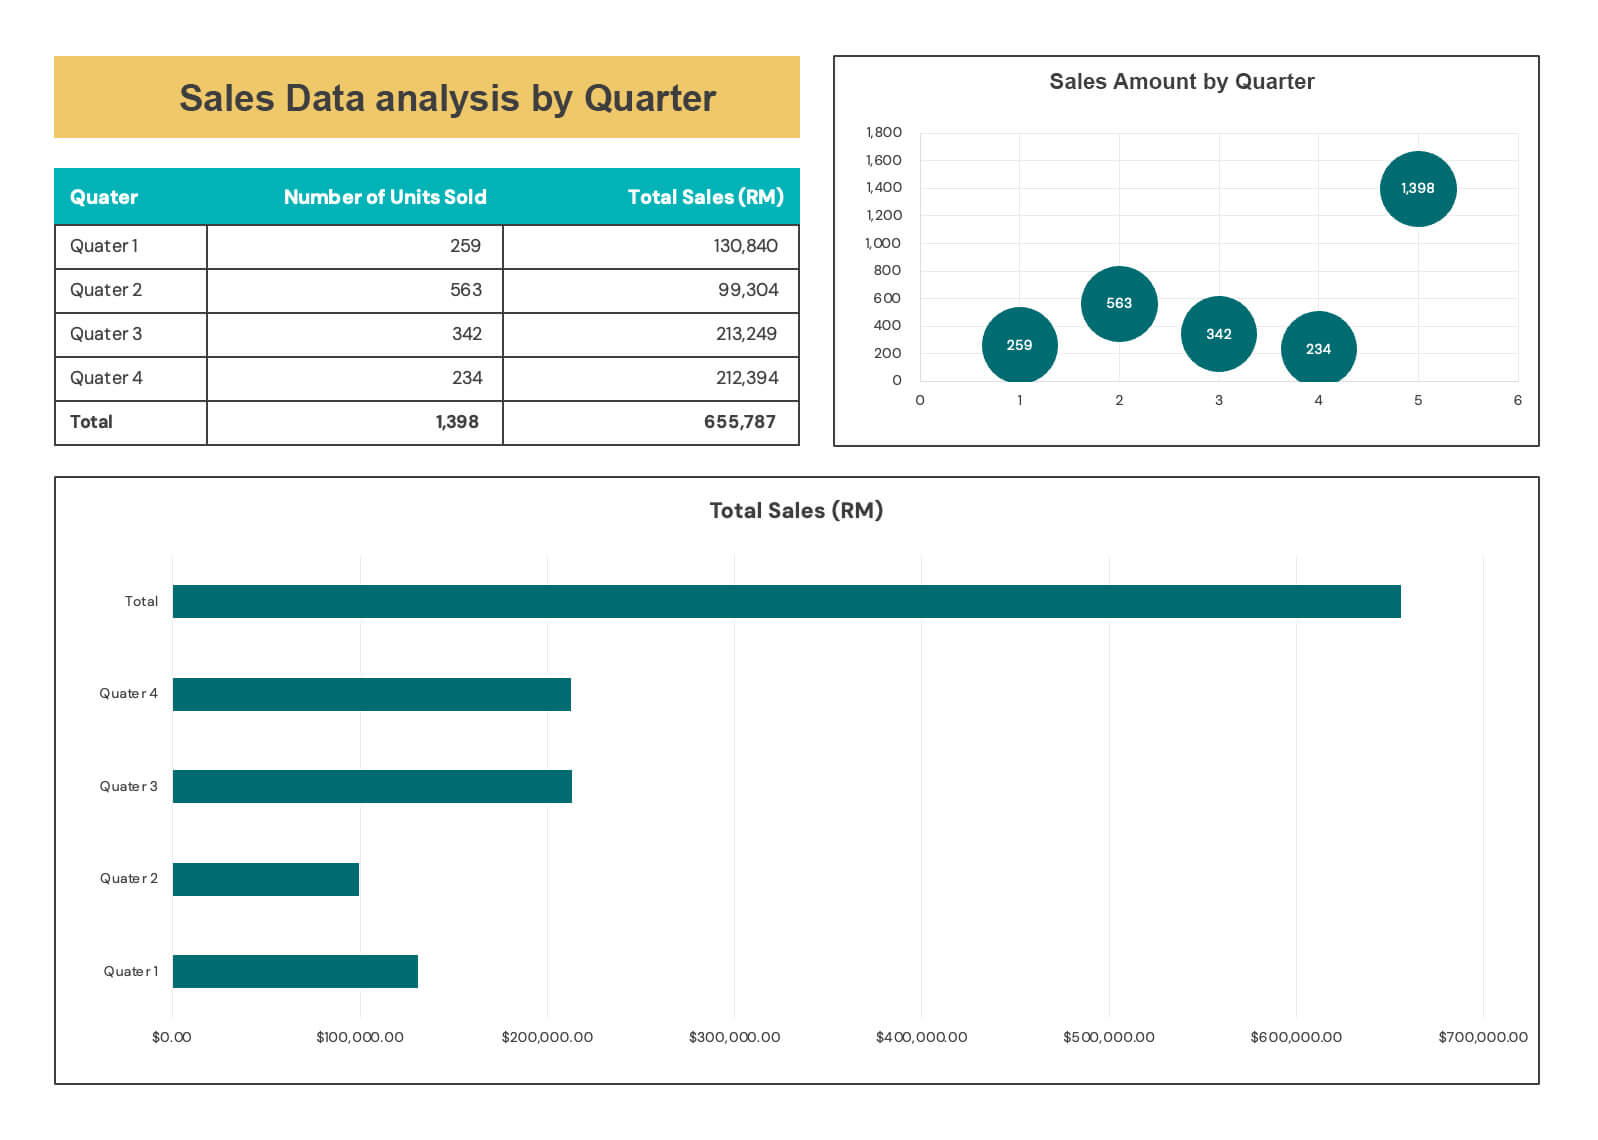
This template emerged from the need to track both unit sales and monetary performance across quarters. It features an intuitive design that combines tabular data with bubble and bar chart visualizations, making it ideal for businesses tracking multiple sales metrics. Designed for sales managers, business analysts, and executives who need clear visibility of quarterly performance trends.
WHAT IS SALES DATA ANALYSIS BY QUARTER?
Quarterly sales analysis is a methodology for tracking both units sold and revenue performance across three-month periods. The template implements this through a dual-metric approach, automatically calculating totals and presenting data through multiple visualization formats. It breaks down performance into units and monetary values while maintaining clear quarter-by-quarter comparisons.
WHY IT MATTERS
Business managers often struggle to maintain clear visibility of both unit sales and revenue performance across quarters. Manual tracking of these dual metrics can be time-consuming and make it difficult to spot trends and patterns.
The template eliminates these challenges by automatically generating visual representations that clearly show the relationship between units sold and total revenue. This enables quick identification of high-performing quarters and helps understand the correlation between sales volume and revenue generation.
BENEFITS
- Automatically calculates total units sold and revenue figures for each quarter
- Provides dual visualization through bubble chart and horizontal bar graph for enhanced data comprehension
- Features clear presentation of monetary values in local currency (RM) with automated formatting
- Enables easy comparison between quarters through synchronized data visualization
HOW TO USE
- Enter quarterly data for number of units sold and total sales revenue
- Monitor automatic calculation of totals and aggregated figures
- Review the visual representations to analyze trends in both units and revenue
USE CASES
- Quarterly Business Reviews: Present comprehensive sales performance data
- Revenue Analysis: Track monetary performance against units sold
- Performance Forecasting: Use historical quarterly data to project future sales
- Stakeholder Reporting: Create professional visualizations for business presentations
TECHNICAL ESSENTIALS
- Compatible with Excel 2010 and later versions
- Features include automatic calculation formulas, bubble charts, and horizontal bar graphs
- Key components: data input table, units sold visualization, and revenue comparison chart
- No macros required; operates on standard Excel formulas and charts
Transform your quarterly sales reporting into a clear, insightful process that captures both unit sales and revenue performance. This template eliminates the complexity of tracking multiple metrics, allowing you to focus on identifying trends and making strategic decisions. Start using it today to gain better visibility into your quarterly sales performance.


.jpg)
